Market Outlook
May 29, 2017
Market Cues
Domestic Indices
Chg (%)
(Pts)
(Close)
Indian markets are likely to open on positive note tracking the SGX Nifty and Global
BSE Sensex
0.9
278
31,028
markets.
Nifty
0.9
85
9,595
The S&P 500 index, gained 0.03% to finish at a fresh all-time high of 2015 buoyed
Mid Cap
2.1
293
14,520
by gains in consumer-staples, consumer-discretionary and materials stocks, while
Small Cap
1.6
238
15,086
real estate fell. The Nasdaq Composite added 0.08% to end at 6,210.However, the
Dow Jones Industrial Average closed -0.01% lower at 21,080.
Bankex
0.8
204
26,495
The FTSE ended with an all-time high, as the pound dropped to a one-month low
after a poll showed a further narrowing of the ruling Conservative Party’s lead
Global Indices
Chg (%)
(Pts)
(Close)
(0.0)
(3)
21,080
before the country’s general election. The FTSE added +0.40% to close at 7,548.
Dow Jones
0.9
174
20,579
0.1
5
6,210
Nasdaq
0.9
54
5,917
The indian markets witnessed a historic day as benchmark indices clocked fresh
0.4
30
7,548
record highs, with the Sensex clocking 31,000 for the first time ever, along with the
FTSE
0.1
4
7,119
Nifty at 9600. The Nifty Bank also hit a record high during the Friday’s trade.
Nikkei
(0.6)
(126)
19,687
Hang Seng
0.0
238
25,639
Private sector banks fired on all cylinders along with midcaps, metals as well as auto
stocks. Meanwhile, pharma stocks continued to bleed and sulk on the back of poor
Shanghai Com
0.1
2
3,110
outlook for the sector in the US as well as bad results at home
Advances / Declines
BSE
NSE
Result Reviews
Advances
1,835
1,247
Indoco Remedies Q4FY17
Declines
1,853
424
Tech Mahindra Q4FY17
Unchanged
175
72
Sun Pharma Q4FY17
Detailed analysis on Pg2
Volumes (` Cr)
Investor’s Ready Reckoner
BSE
3,836
Key Domestic & Global Indicators
NSE
26,556
Stock Watch: Latest investment recommendations on 150+ stocks
Refer Pg6 onwards
#Net Inflows (` Cr)
Net
Mtd
Ytd
Top Picks
789
10,372
52,384
FII
(565)
(2,249)
41,972
CMP
Target
Upside
Company
Sector
Rating
288
7,739
28,421
(`)
(`)
(%)
MFs
804
4,895
14,333
Blue Star
Capital Goods
Buy
646
760
17.7
Dewan Housing Fin. Financials
Buy
411
520
26.6
Top Gainers
Price (`)
Chg (%)
Mahindra Lifespace Real Estate
Buy
434
522
20.2
Sintexem
130
17.3
Navkar Corporation Others
Buy
208
265
27.3
Hindpetro
567
11.4
KEI Industries
Capital Goods
Buy
202
239
17.9
More Top Picks on Pg4
Jpassociat
13
10.6
Dishman
293
9.1
Key Upcoming Events
Kscl
570
8.8
Previous
Consensus
Date
Region
Event Description
Reading
Expectations
May 30, 2017 Euro Zone Euro-Zone Consumer Confidence
(3.30)
(3.30)
Top Losers
Price (`)
Chg (%)
May 30, 2017 Germany Unemployment change (000's)
(15.00)
(14.00)
Videoind
247
(10.0)
May 31, 2017 US
Consumer Confidence
120.30
119.85
May 31, 2017 China
PMI Manufacturing
51.20
51.00
Sunpharma
569
(3.9)
Jun 01, 2017 UK
PMI Manufacturing
57.30
56.50
Britannia
3,413
(2.9)
Jun 01, 2017 US
Initial Jobless claims
234.00
239.00
Ioc
426
(2.8)
More Events on Pg5
Cipla
492
(2.5)
#As on 26th May 2017
Market Outlook
May 29, 2017
News Analysis
Review
Indoco Remedies (CMP: `192 / TP: `240 / Upside: 25.0%)
For 4QFY2017, the company, posted results much lower than expected. For the
quarter the sales, came in at `266cr V/s `311cr expected, registering a yoy growth
of 4.2%. The formulation sales (`252cr) posted a yoy growth of 3.3% yoy, while
API(`12cr), a yoy dip of 4.7%. CRO (`1.9cr) posted a growth of 21.4%. In
formulations, the domestic markets (`130.1cr) a yoy dip of 2.2%.
On the OPM front, the Gross margins came in at 63.4% V/s 67.7% in 4QFY2016,
which along with 13.8% yoy growth in the employee expenditure. R&D expenses
during the quarter 5.2% of sales V/s 7.4% of sales in 4QFY2016. Thus the Adj. net
profit is expected to come in at `18cr V/s `39cr expected a yoy dip of 10.3%.
We recommend a buy on the stock, on back of valuations.
Sun Pharmaceuticals (CMP: `569 / TP: Under Review / Upside: )
For 4QFY2017, the company posted tepid numbers. For the quarter, the sales
came in at `6,825cr V/s `7,600cr expected, registering a yoy dip of 7.9%.
India sales at `1,916cr, were up by 10% over 4QFY2016, US finished dosage
sales at US$381mn down by 34% over 4QFY2016.Emerging Markets sales at
US$181mn up by 46% 4QFY2016. Rest of World sales at US$109mn, growth of
38% over 4QFY2016 last year. This growth was partly driven by the consolidation
of the Japan business.
On the OPM front, the gross margins came in at 67.8% V/s 80.4% in 4QFY2016,
which lead the EBDITA Margins came in at 18.1% V/s 31.1% expected V/s 31.0%
in 4QFY2016. Company’s performance was impacted by the challenging generic
pricing environment in the US.
In spite of the sharp dip, the high other income at `536cr V/s `185cr in
4QFY2016, lead the Adj. net profit, come in at `1,385cr V/s `1,433cr expected, a
yoy dip of 19.2%.Other operating income for the quarter at `312cr included a
milestone payment from Almirall S.A (Spain) as part of the licensing agreement for
the development and commercialization of Tildrakizumab for psoriasis in Europe.
We maintain our buy on the stock, on back of valuations.
Market Outlook
May 29, 2017
Tech Mahindra (CMP: `431 / TP: `600 / Upside: 39.2%)
For 4QFY2017, posted bad set of numbers. For the quarter, sales came in at
US$1,131mn V/s 1,129mn expected, registering a qoq growth of 1.3%. On rupee
front the sales is expected to come in at `7,495cr V/s `7,533cr expected, a qoq
de-growth of 0.8%. On Constant Currency (CC) terms, the company posted a
0.9% QoQ growth during the quarter.
In terms of geography, the USA was main dampener; it constituted 45.1% of sales
V/s 46.7% of sales in 3QFY2016, while ROW was the key driver constituting
25.3% of sales V/s 23.9% of sales in 3QFY2016. In terms, of the industries, the
manufacturing came in at 19.2% of sales v/s 18.4% of sales in 3QFY2016.BFSI
was the main driver, which lead the segment contribute around 14.1% of sales V/s
13.1% of sales in 3QFY2016.
On, operating front, a 4.2% qoq rise in the cost of revenues, resulted in the
EBDITA and EBIT Margins coming at 12.0% and 8.2% V/s 15.5% and 12.2%
expected respectively, qoq dip of 371 and 421 bps. Thus the Adj. net profit came
in at `588cr V/s `741cr expected qoq dip of 30.4%.
On employee productivity matrix, the company had utiilsatation excluding trainee,
was 81% V/s 83% in 3QFY2016, while overall was stagnant at 77%. Attrition was
17% V/s 18% in 3QFY2016.
We maintain our buy on the stock, on back of valuations.
Economic and Political News
Need to make India defence manufacturing hub: Jaitley
RBI guidelines on P2P lending platform likely by June-July'
EPFO to invest ` 20,000cr in equities in 2017-18: Dattatreya
Corporate News
ONGC looking to aggressively expand acreage under exploration.
Maruti aims to sell 3 lakh automatic cars annually by 2020
Coal India's April coal despatch grows 6% to 45 million tonnes
Market Outlook
May 29, 2017
Quarterly Bloomberg Brokers Consensus Estimate
Bharat Heavy Electricals Ltd - May 29, 2017
Particulars ( ` cr)
4QFY17E
4QFY16
y-o-y (%)
3QFY17
q-o-q (%)
Net sales
10,995
9,792
12.3
6,187
77.7
EBITDA
670
364
84.1
224
199.2
EBITDA margin (%)
6.1
3.7
3.6
Net profit
609
360
69.3
94
550.6
Bharat Petroleum Corp Ltd - May 29, 2017
Particulars ( ` cr)
4QFY17E
4QFY16
y-o-y (%)
3QFY17
q-o-q (%)
Net sales
55,321
44,146
25.3
53,493
3.4
EBITDA
2,282
3,686
(38.1)
3,617
(36.9)
EBITDA margin (%)
4.1
8.3
6.8
Net profit
1,661
2,549
(34.8)
2,272
(26.9)
Aurobindo Pharma Consol - May 29, 2017
Particulars ( ` cr)
4QFY17E
4QFY16
y-o-y (%)
3QFY17
q-o-q (%)
Net sales
4,013
3,675
9.2
3,844
4.4
EBITDA
941
882
6.7
895
5.2
EBITDA margin (%)
23.5
24.0
23.3
Net profit
600
563
6.6
579
3.7
Power Grid Corp of India Ltd - May 29, 2017
Particulars ( ` cr)
4QFY17E
4QFY16
y-o-y (%)
3QFY17
q-o-q (%)
Net sales
6,930
5,760
20.3
6,501
6.6
EBITDA
6,118
5,029
21.7
5,959
2.7
EBITDA margin (%)
88.3
87.3
91.7
Net profit
2,082
1,599
30.2
1,930
7.9
NTPC Ltd - May 29, 2017
Particulars ( ` cr)
4QFY17E
4QFY16
y-o-y (%)
3QFY17
q-o-q (%)
Net sales
20,033
17,990
11.4
19,287
3.9
EBITDA
5,381
5,458
(1.4)
5,251
2.5
EBITDA margin (%)
26.9
30.3
27.2
Net profit
2,446
2,716
(10.0)
2,469
(0.9)
Larsen & Toubro Ltd - May 29, 2017
Particulars ( ` cr)
4QFY17E
4QFY16 y-o-y (%)
3QFY17
q-o-q (%)
Net sales
36582
20,841
75.5
15,769
132.0
EBITDA
4951
3,193
55.0
1,352
266.2
EBITDA margin (%)
13.5
15.3
8.6
Net profit
2651
2,539
4.4
934
183.8
Market Outlook
May 29, 2017
Top Picks ★★★★★
Market Cap
CMP
Target
Upside
Company
Rationale
(` Cr)
(`)
(`)
(%)
Strong growth in domestic business due to its leadership
in acute therapeutic segment. Alkem expects to launch
Alkem Laboratories
22,387
1,872
2,257
20.5
more products in USA, which bodes for its international
business.
We expect the company would report strong profitability
Asian Granito
1,067
355
405
14.2
owing to better product mix, higher B2C sales and
amalgamation synergy..
Favourable outlook for the AC industry to augur well for
Cooling products business which is out pacing the market
Blue Star
6,174
646
760
17.7
growth. EMPPAC division's profitability to improve once
operating environment turns around..
With a focus on the low and medium income (LMI)
consumer segment, the company has increased its
Dewan Housing Finance
12,868
411
520
26.6
presence in tier-II & III cities where the growth opportunity
is immense.
Strong loan growth backed by diversified loan portfolio
and adequate CAR. ROE & ROA likely to remain decent
Equitas Holdings
5,193
154
235
52.9
as risk of dilution remains low. Attractive valuations
considering growth.
Economic recovery to have favourable impact on
advertising & circulation revenue growth. Further, the
Jagran Prakashan
5,860
179
225
25.5
acquisition of a radio business (Radio City) would also
boost the company's revenue growth.
High order book execution in EPC segment, rising B2C
KEI Industries
1,574
202
239
17.9
sales and higher exports to boost the revenues and
profitability
Speedier execution and speedier sales, strong revenue
Mahindra Lifespace
2,228
434
522
20.2
visibilty in short-to-long run, attractive valuations
Massive capacity expansion along with rail advantage at
Navkar Corporation
2,970
208
265
27.3
ICD as well CFS augurs well for the company
Strong brands and distribution network would boost
Siyaram Silk Mills
1,669
1,780
1,872
5.2
growth going ahead. Stock currently trades at an
inexpensive valuation.
Market leadership in Hindi news genre and no.
2
viewership ranking in English news genre, exit from the
TV Today Network
1,511
253
344
35.8
radio business, and anticipated growth in ad spends by
corporates to benefit the stock.
Source: Company, Angel Research
Market Outlook
May 29, 2017
Key Upcoming Events
Result Calendar
Date
Company
BHEL, Jagran Prakashan, Coal India, Bajaj Electrical, Cravatex, Aurobindo Pharma, NTPC, Manpasand Bever.
May 29, 2017
Tata Global, M&M, BGR Energy , Jyoti Structures, Rural Elec.Corp., PVR, SAIL, Hindalco, Finolex Cables, Anant Raj,
May 30, 2017
Competent Automobiles
Source: Bloomberg, Angel Research
Global economic events release calendar
Bloomberg Data
Date
Time
Country
Event Description
Unit
Period
Last Reported
Estimated
May 30, 2017
2:30 PMEuro Zone
Euro-Zone Consumer Confidence
Value
May F
(3.30)
(3.30)
1:25 PMGermany
Unemployment change (000's)
Thousands
May
(15.00)
(14.00)
May 31, 2017
7:30 PMUS
Consumer Confidence
S.A./ 1985=100 May
120.30
119.85
6:30 AMChina
PMI Manufacturing
Value
May
51.20
51.00
Jun 01, 2017
2:00 PMUK
PMI Manufacturing
Value
May
57.30
56.50
6:00 PMUS
Initial Jobless claims
Thousands
May 27
234.00
239.00
1:25 PMGermany
PMI Manufacturing
Value
May F
59.40
59.40
Jun 02, 2017
6:00 PMUS
Change in Nonfarm payrolls
Thousands
May
211.00
180.00
6:00 PMUS
Unnemployment rate
%
May
4.40
4.40
Jun 06, 2017
1:25 PMGermany
PMI Services
Value
May F
55.20
Jun 07, 2017
2:30 PMEuro Zone
Euro-Zone GDP s.a. (QoQ)
% Change
1Q F
0.50
2:30 PMIndia
RBI Reverse Repo rate
%
Jun 7
6.00
6.00
2:30 PMIndia
RBI Repo rate
%
Jun 7
6.25
6.25
2:30 PMIndia
RBI Cash Reserve ratio
%
Jun 7
4.00
4.00
Jun 08, 2017
China
Exports YoY%
% Change
May
8.00
5:15 PMEuro Zone
ECB announces interest rates
%
Jun 8
-
Jun 09, 2017
India
Exports YoY%
% Change
May
19.80
India
Imports YoY%
% Change
May
49.10
2:00 PMUK
Industrial Production (YoY)
% Change
Apr
1.40
7:00 AMChina
Consumer Price Index (YoY)
% Change
May
1.20
Jun 12, 2017
5:30 PMIndia
Industrial Production YoY
% Change
Apr
2.70
Source: Bloomberg, Angel Research
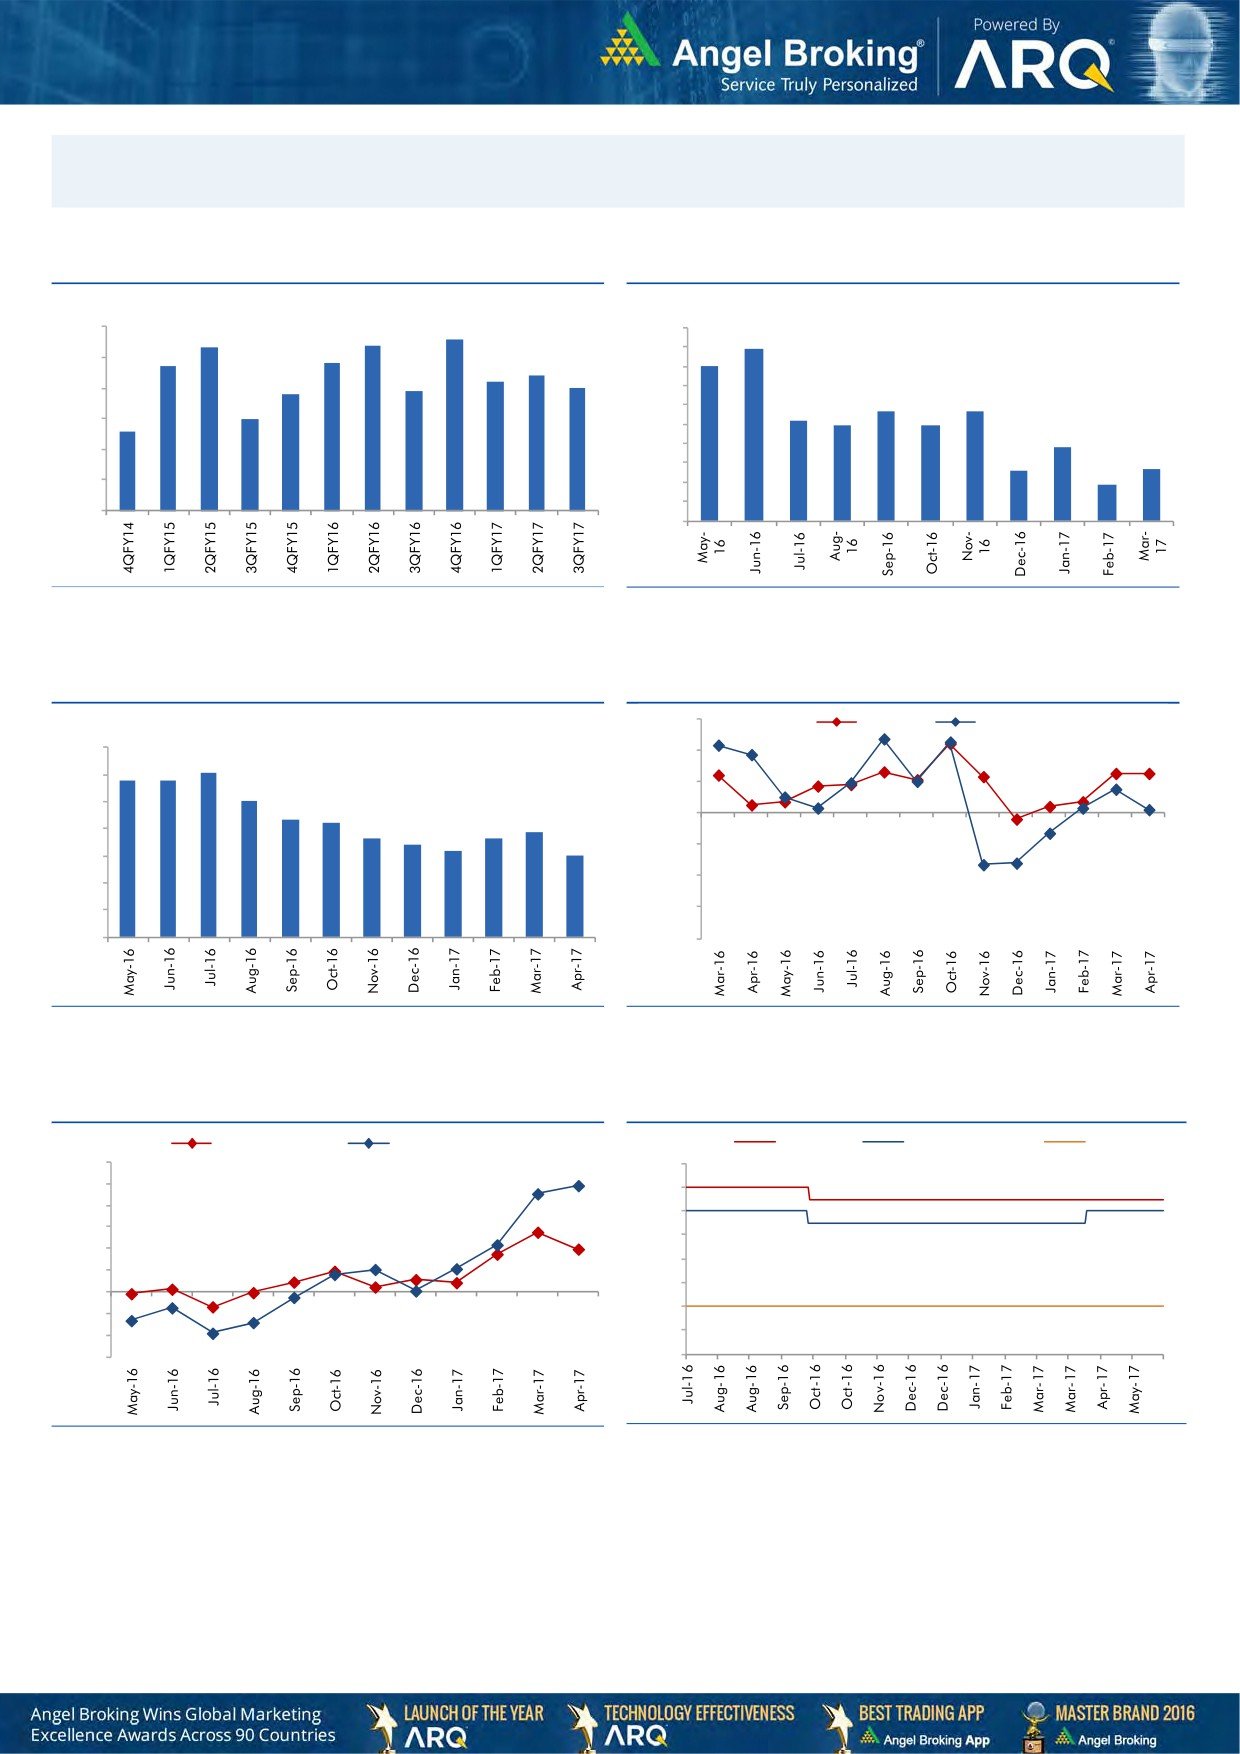
Market Outlook
May 29, 2017
Macro watch
Exhibit 1: Quarterly GDP trends
Exhibit 2: IIP trends
(%)
(%)
8.6
9.0
8.3
8.4
10.0
8.9
7.7
7.8
9.0
8.0
8.0
7.4
7.2
8.0
6.9
7.0
6.8
7.0
7.0
5.7
5.7
6.0
6.0
5.2
4.9
4.9
6.0
5.6
5.0
3.8
4.0
5.0
2.6
2.7
3.0
1.9
4.0
2.0
1.0
3.0
-
Source: CSO, Angel Research
Source: MOSPI, Angel Research
Exhibit 3: Monthly CPI inflation trends
Exhibit 4: Manufacturing and services PMI
56.0
Mfg. PMI
Services PMI
(%)
7.0
54.0
6.1
5.8
5.8
6.0
5.1
52.0
5.0
4.3
4.2
3.9
50.0
3.6
3.7
4.0
3.4
3.2
3.0
48.0
3.0
46.0
2.0
1.0
44.0
-
42.0
Source: MOSPI, Angel Research
Source: Market, Angel Research; Note: Level above 50 indicates expansion
Exhibit 5: Exports and imports growth trends
Exhibit 6: Key policy rates
(%)
Exports yoy growth
Imports yoy growth
(%)
Repo rate
Reverse Repo rate
CRR
60.0
7.00
50.0
6.50
40.0
6.00
30.0
5.50
20.0
5.00
10.0
4.50
0.0
4.00
(10.0)
(20.0)
3.50
(30.0)
3.00
Source: Bloomberg, Angel Research
Source: RBI, Angel Research
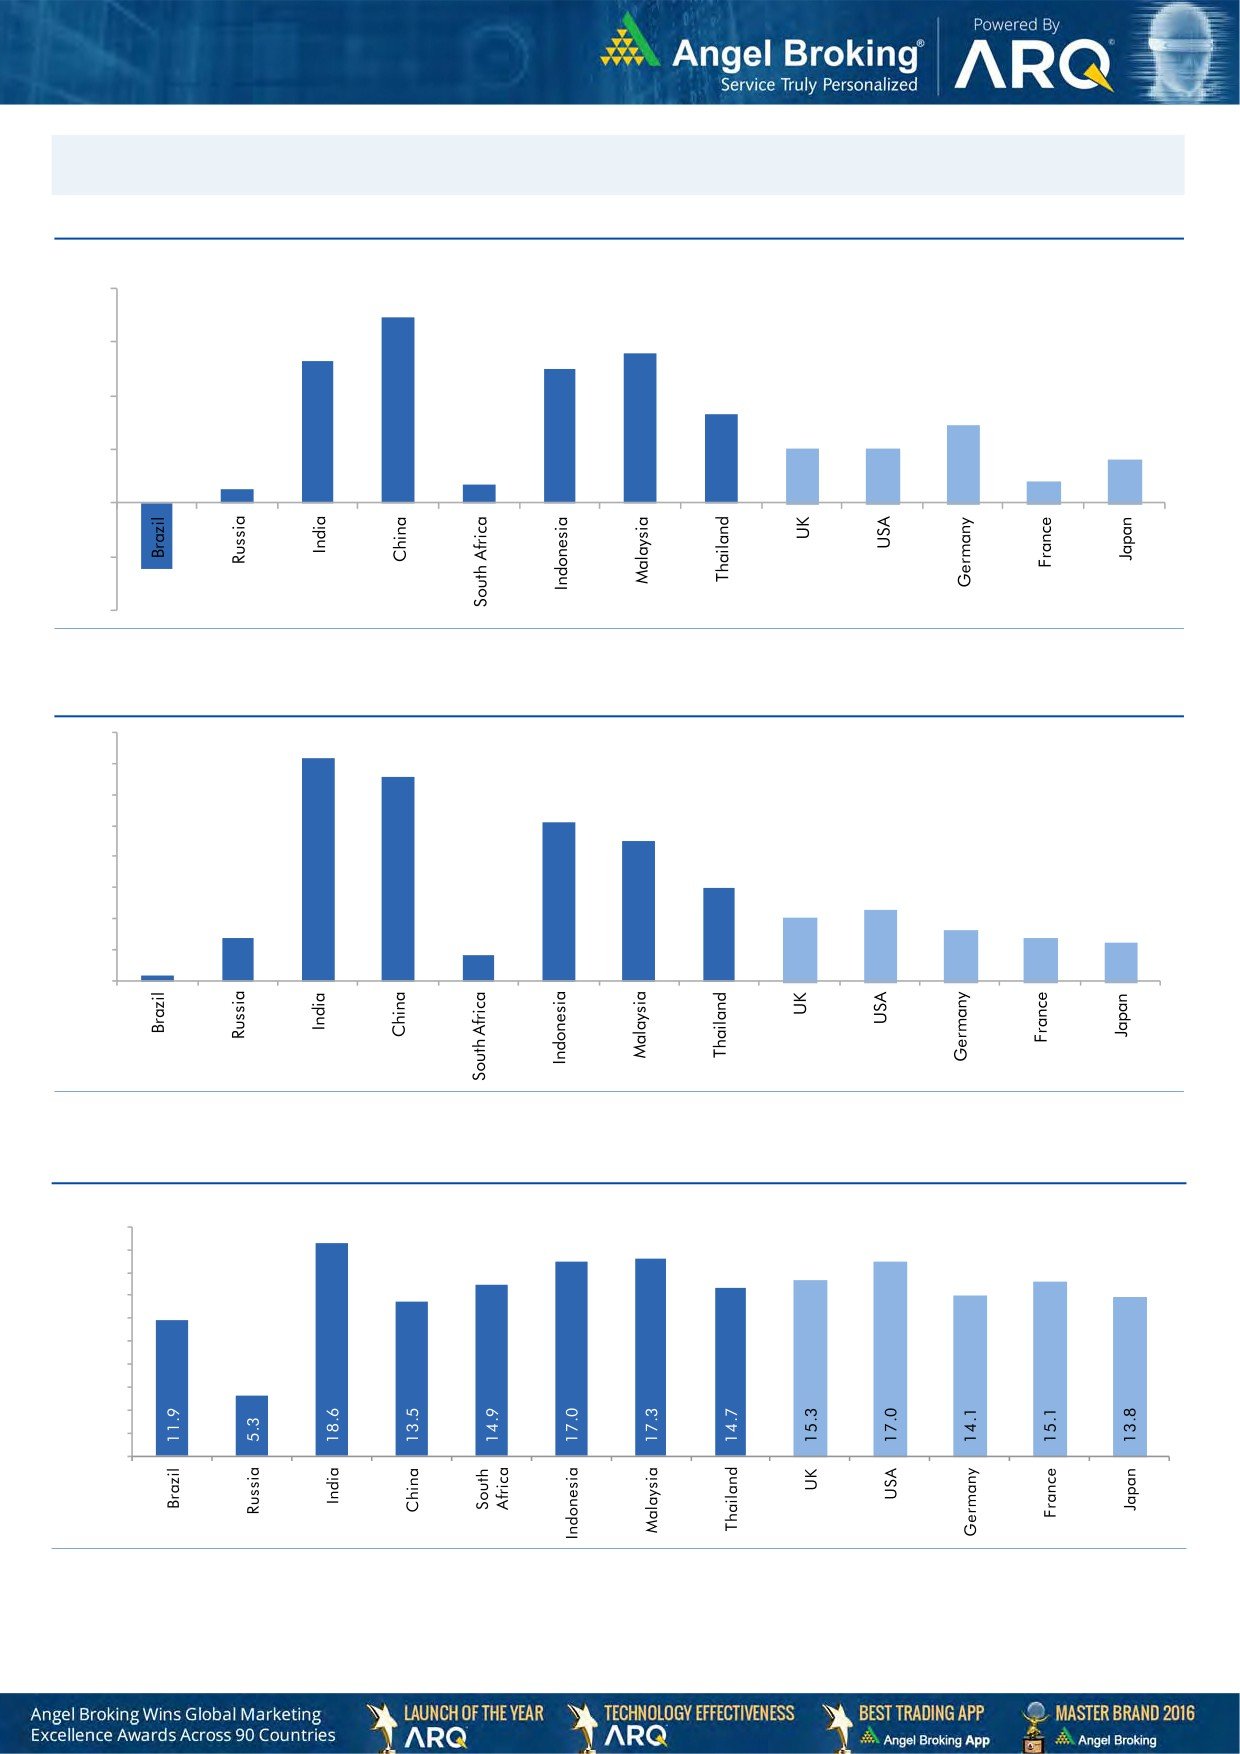
Market Outlook
May 29, 2017
Global watch
Exhibit 1: Latest quarterly GDP Growth (%, yoy) across select developing and developed countries
(%)
8.0
6.9
5.6
6.0
5.3
5.0
0.7
4.0
3.3
2.9
2.0
2.0
0.5
2.0
1.6
0.8
-
(2.0)
(2.5)
(4.0)
Source: Bloomberg, Angel Research
Exhibit 2: 2016 GDP Growth projection by IMF (%, yoy) across select developing and developed countries
(%)
7.2
6.6
7.0
6.0
5.1
5.0
4.5
4.0
3.0
3.0
2.3
2.0
1.4
1.6
2.0
1.4
1.2
0.2
0.8
1.0
-
Source: IMF, Angel Research
Exhibit 3: One year forward P-E ratio across select developing and developed countries
(x)
20.0
18.0
16.0
14.0
12.0
10.0
8.0
6.0
4.0
2.0
-
Source: IMF, Angel Research
Market Outlook
May 29, 2017
Exhibit 4: Relative performance of indices across globe
Returns (%)
Country
Name of index
Closing price
1M
3M
1YR
Brazil
Bovespa
64,085
(1.6)
(6.5)
29.9
Russia
Micex
1,934
(0.5)
(8.7)
(0.1)
India
Nifty
9,595
3.1
8.1
24.1
China
Shanghai Composite
3,110
(0.8)
(4.6)
9.1
South Africa
Top 40
47,535
2.9
4.5
1.1
Mexico
Mexbol
49,675
(0.3)
4.3
7.7
Indonesia
LQ45
954
1.5
7.3
17.8
Malaysia
KLCI
1,772
0.9
4.0
8.5
Thailand
SET 50
992
(0.1)
0.2
10.8
USA
Dow Jones
21,080
0.5
1.2
17.9
UK
FTSE
7,548
3.7
3.4
21.1
Japan
Nikkei
19,687
5.7
1.6
18.3
Germany
DAX
12,602
1.1
5.0
23.5
France
CAC
5,337
1.1
9.0
20.7
Source: Bloomberg, Angel Research
Stock Watch
May 29, 2017
Company Name
Reco
CMP
Target
Mkt Cap
Sales ( Čcr )
OPM(%)
EPS (Č)
PER(x)
P/BV(x)
RoE(%)
EV/Sales(x)
(Č)
Price ( Č)
( Č cr )
FY17E FY18E
FY17E
FY18E
FY17E
FY18E
FY17E
FY18E
FY17E
FY18E
FY17E
FY18E
FY17E
FY18E
Agri / Agri Chemical
Rallis
Neutral
242
-
4,696
1,937
2,164
13.3
14.3
9.0
11.0
26.8
22.0
4.7
4.1
18.4
19.8
2.5
2.2
United Phosphorus
Neutral
837
-
42,530
15,176
17,604
18.5
18.5
37.4
44.6
22.4
18.8
4.4
3.6
21.4
21.2
2.9
2.5
Auto & Auto Ancillary
Ashok Leyland
Buy
92
111
26,097
20,021
21,915
11.6
11.9
4.5
5.3
20.4
17.2
4.2
3.7
20.6
21.5
1.2
1.1
Bajaj Auto
Neutral
2,816
-
81,494
25,093
27,891
19.5
19.2
143.9
162.5
19.6
17.3
5.5
4.7
30.3
29.4
3.0
2.6
Bharat Forge
Neutral
1,132
-
26,358
7,726
8,713
20.5
21.2
35.3
42.7
32.1
26.5
5.9
5.4
18.9
20.1
3.5
3.0
Eicher Motors
Neutral
28,351
-
77,178
16,583
20,447
17.5
18.0
598.0
745.2
47.4
38.0
16.2
12.3
41.2
38.3
4.5
3.6
Gabriel India
Neutral
129
-
1,852
1,544
1,715
9.0
9.3
5.4
6.3
23.9
20.5
4.5
4.0
18.9
19.5
1.2
1.0
Hero Motocorp
Neutral
3,616
-
72,212
28,083
30,096
15.3
15.7
171.8
187.0
21.0
19.3
7.3
6.2
30.1
27.9
2.4
2.2
Jamna Auto Industries Neutral
240
-
1,909
1,486
1,620
9.8
9.9
15.0
17.2
16.0
13.9
3.5
3.0
21.8
21.3
1.4
1.2
L G Balakrishnan & Bros Neutral
699
-
1,098
1,302
1,432
11.6
11.9
43.7
53.0
16.0
13.2
2.3
2.1
13.8
14.2
0.9
0.8
Mahindra and Mahindra Neutral
1,341
-
83,279
46,534
53,077
11.6
11.7
67.3
78.1
19.9
17.2
3.2
2.8
15.4
15.8
1.8
1.5
Maruti
Neutral
7,073
-
213,672
67,822
83,288
16.0
16.4
253.8
312.4
27.9
22.6
6.4
5.2
23.0
22.9
2.8
2.2
Minda Industries
Neutral
596
-
5,152
2,728
3,042
9.0
9.1
68.2
86.2
8.7
6.9
2.0
1.6
23.8
24.3
2.0
1.7
Motherson Sumi
Neutral
447
-
62,732
45,896
53,687
7.8
8.3
13.0
16.1
34.3
27.8
11.1
8.8
34.7
35.4
1.4
1.2
Rane Brake Lining
Neutral
1,080
-
855
511
562
11.3
11.5
28.1
30.9
38.4
34.9
5.9
5.3
15.3
15.0
1.8
1.7
Setco Automotive
Neutral
41
-
546
741
837
13.0
13.0
15.2
17.0
2.7
2.4
0.4
0.4
15.8
16.3
1.1
1.0
Tata Motors
Neutral
481
-
138,809
300,209
338,549
8.9
8.4
42.7
54.3
11.3
8.9
1.8
1.5
15.6
17.2
0.6
0.5
TVS Motor
Neutral
534
-
25,370
13,390
15,948
6.9
7.1
12.8
16.5
41.9
32.3
10.4
8.2
26.3
27.2
1.9
1.6
Amara Raja Batteries
Buy
867
1,009
14,803
5,305
6,100
16.0
16.3
28.4
34.0
30.5
25.5
5.9
4.9
19.3
19.3
2.8
2.4
Exide Industries
Neutral
233
-
19,780
7,439
8,307
15.0
15.0
8.1
9.3
28.7
25.0
4.0
3.6
14.3
16.7
2.3
2.0
Apollo Tyres
Neutral
232
-
11,822
12,877
14,504
14.3
13.9
21.4
23.0
10.8
10.1
1.7
1.5
16.4
15.2
1.1
1.0
Ceat
Neutral
1,683
-
6,807
7,524
8,624
13.0
12.7
131.1
144.3
12.8
11.7
2.4
2.0
19.8
18.6
1.0
0.9
JK Tyres
Neutral
168
-
3,809
7,455
8,056
15.0
15.0
21.8
24.5
7.7
6.9
1.6
1.3
22.8
21.3
0.6
0.5
Swaraj Engines
Neutral
1,840
-
2,286
660
810
15.2
16.4
54.5
72.8
33.8
25.3
10.5
9.6
31.5
39.2
3.3
2.7
Subros
Neutral
253
-
1,515
1,488
1,681
11.7
11.9
6.4
7.2
39.5
35.2
4.2
3.8
10.8
11.4
1.3
1.1
Indag Rubber
Neutral
211
-
553
286
326
19.8
16.8
11.7
13.3
18.0
15.8
3.0
2.8
17.8
17.1
1.6
1.4
Capital Goods
ACE
Neutral
63
-
626
709
814
4.1
4.6
1.4
2.1
45.2
30.1
1.9
1.8
4.4
6.0
1.0
0.9
BEML
Neutral
1,217
-
5,067
3,451
4,055
6.3
9.2
31.4
57.9
38.8
21.0
2.3
2.1
6.3
10.9
1.6
1.3
Bharat Electronics
Neutral
175
-
39,077
8,137
9,169
16.8
17.2
58.7
62.5
3.0
2.8
0.5
0.4
44.6
46.3
3.8
3.4
Stock Watch
May 29, 2017
Company Name
Reco
CMP
Target
Mkt Cap
Sales ( Čcr )
OPM(%)
EPS (Č)
PER(x)
P/BV(x)
RoE(%)
EV/Sales(x)
(Č)
Price ( Č)
( Č cr )
FY17E
FY18E
FY17E
FY18E
FY17E
FY18E
FY17E
FY18E
FY17E
FY18E
FY17E
FY18E
FY17E
FY18E
Capital Goods
Voltas
Neutral
499
-
16,498
6,511
7,514
7.9
8.7
12.9
16.3
38.7
30.6
7.0
6.1
16.7
18.5
2.3
2.0
BGR Energy
Neutral
160
-
1,154
16,567
33,848
6.0
5.6
7.8
5.9
20.5
27.1
1.2
1.1
4.7
4.2
0.2
0.1
BHEL
Neutral
158
-
38,770
28,797
34,742
-
2.8
2.3
6.9
68.9
23.0
1.2
1.1
1.3
4.8
1.0
0.7
Blue Star
Buy
646
760
6,174
4,283
5,077
5.9
7.3
14.9
22.1
43.4
29.2
8.4
7.1
20.4
26.4
1.5
1.3
CG Power and Industrial
Neutral
93
-
5,851
5,777
6,120
5.9
7.0
3.3
4.5
28.3
20.7
1.2
1.2
4.4
5.9
1.0
0.8
Solutions
Greaves Cotton
Neutral
157
-
3,841
1,755
1,881
16.8
16.9
7.8
8.5
20.2
18.5
4.0
3.8
20.6
20.9
1.9
1.7
Inox Wind
Neutral
141
-
3,126
5,605
6,267
15.7
16.4
24.8
30.0
5.7
4.7
1.6
1.2
25.9
24.4
0.6
0.5
KEC International
Neutral
254
-
6,539
9,294
10,186
7.9
8.1
9.9
11.9
25.7
21.4
3.8
3.3
15.6
16.3
0.9
0.9
KEI Industries
Buy
202
239
1,574
2,682
3,058
10.4
10.0
11.7
12.8
17.2
15.8
3.5
2.9
20.1
18.2
0.8
0.7
Thermax
Neutral
1,013
-
12,068
5,421
5,940
7.3
7.3
25.7
30.2
39.4
33.5
4.8
4.4
12.2
13.1
2.1
1.9
VATech Wabag
Neutral
675
-
3,683
3,136
3,845
8.9
9.1
26.0
35.9
26.0
18.8
3.2
2.8
13.4
15.9
1.1
0.9
Cement
ACC
Neutral
1,629
-
30,586
11,225
13,172
13.2
16.9
44.5
75.5
36.6
21.6
3.5
3.2
11.2
14.2
2.7
2.3
Ambuja Cements
Neutral
241
-
47,785
9,350
10,979
18.2
22.5
5.8
9.5
41.5
25.3
3.5
3.1
10.2
12.5
5.1
4.4
India Cements
Neutral
199
-
6,102
4,364
4,997
18.5
19.2
7.9
11.3
25.2
17.6
1.8
1.8
8.0
8.5
2.2
1.9
JK Cement
Neutral
1,094
-
7,647
4,398
5,173
15.5
17.5
31.2
55.5
35.1
19.7
4.2
3.7
12.0
15.5
2.3
1.9
J K Lakshmi Cement
Neutral
480
-
5,652
2,913
3,412
14.5
19.5
7.5
22.5
64.1
21.4
3.9
3.3
12.5
18.0
2.5
2.1
Orient Cement
Neutral
154
-
3,151
2,114
2,558
18.5
20.5
8.1
11.3
19.0
13.6
2.8
2.4
9.0
14.0
2.1
1.7
UltraTech Cement
Neutral
4,155
-
114,062
25,768
30,385
21.0
23.5
111.0
160.0
37.4
26.0
4.8
4.2
13.5
15.8
4.5
3.8
Construction
ITNL
Neutral
105
-
3,467
8,946
10,017
31.0
31.6
8.1
9.1
13.0
11.6
0.5
0.5
4.2
5.0
3.7
3.5
KNR Constructions
Neutral
200
-
2,808
1,385
1,673
14.7
14.0
41.2
48.5
4.9
4.1
0.9
0.8
14.9
15.2
2.1
1.7
Larsen & Toubro
Neutral
1,787
-
166,799
111,017
124,908
11.0
11.0
61.1
66.7
29.3
26.8
3.5
3.3
13.1
12.9
2.5
2.3
Gujarat Pipavav Port
Neutral
149
-
7,206
705
788
52.2
51.7
5.0
5.6
29.8
26.6
2.9
2.6
11.2
11.2
9.9
8.3
Nagarjuna Const.
Neutral
87
-
4,859
8,842
9,775
9.1
8.8
5.3
6.4
16.5
13.7
1.3
1.2
8.2
9.1
0.7
0.6
PNC Infratech
Neutral
144
-
3,704
2,350
2,904
13.1
13.2
9.0
8.8
16.0
16.4
0.6
0.5
15.9
13.9
1.7
1.4
Simplex Infra
Neutral
412
-
2,038
6,829
7,954
10.5
10.5
31.4
37.4
13.1
11.0
1.4
1.2
9.9
13.4
0.7
0.6
Power Mech Projects
Neutral
591
-
870
1,801
2,219
12.7
14.6
72.1
113.9
8.2
5.2
1.5
1.3
16.8
11.9
0.5
0.4
Sadbhav Engineering
Neutral
315
-
5,402
3,598
4,140
10.3
10.6
9.0
11.9
35.0
26.5
3.7
3.2
9.9
11.9
1.8
1.5
NBCC
Neutral
195
-
17,523
7,428
9,549
7.9
8.6
8.2
11.0
23.7
17.7
1.2
0.9
28.2
28.7
2.1
1.6
MEP Infra
Neutral
68
-
1,107
1,877
1,943
30.6
29.8
3.0
4.2
22.7
16.2
11.0
7.4
0.6
0.6
2.0
1.8
Stock Watch
May 29, 2017
Company Name
Reco
CMP
Target
Mkt Cap
Sales ( Čcr )
OPM(%)
EPS (Č)
PER(x)
P/BV(x)
RoE(%)
EV/Sales(x)
(Č)
Price ( Č)
( Č cr )
FY17E
FY18E
FY17E
FY18E
FY17E
FY18E
FY17E
FY18E
FY17E
FY18E
FY17E
FY18E
FY17E
FY18E
Construction
SIPL
Neutral
103
-
3,637
1,036
1,252
65.5
66.2
(8.4)
(5.6)
3.9
4.4
(22.8)
(15.9)
11.7
9.8
Engineers India
Neutral
158
-
10,667
1,725
1,935
16.0
19.1
11.4
13.9
13.9
11.4
1.9
1.9
13.4
15.3
5.1
4.6
Financials
Axis Bank
Accumulate
511
580
122,563
46,932
53,575
3.5
3.4
32.4
44.6
15.8
11.5
2.0
1.8
13.6
16.5
-
-
Bank of Baroda
Neutral
180
-
41,429
19,980
23,178
1.8
1.8
11.5
17.3
15.6
10.4
1.8
1.5
8.3
10.1
-
-
Canara Bank
Neutral
360
-
21,488
15,225
16,836
1.8
1.8
14.5
28.0
24.8
12.9
1.7
1.4
5.8
8.5
-
-
Can Fin Homes
Neutral
2,631
-
7,005
420
526
3.5
3.5
86.5
107.8
30.4
24.4
6.6
5.4
23.6
24.1
-
-
Cholamandalam Inv. &
Buy
1,010
1,230
15,784
2,012
2,317
6.3
6.3
42.7
53.6
23.7
18.8
3.7
3.2
16.9
18.3
-
-
Fin. Co.
Dewan Housing Finance Buy
411
520
12,868
2,225
2,688
2.9
2.9
29.7
34.6
13.8
11.9
2.2
1.5
16.1
14.8
-
-
Equitas Holdings
Buy
154
235
5,193
939
1,281
11.7
11.5
5.8
8.2
26.5
18.7
2.3
2.0
10.9
11.5
-
-
Federal Bank
Accumulate
113
125
19,398
8,259
8,995
3.0
3.0
4.3
5.6
26.2
20.1
2.2
2.1
8.5
10.1
-
-
HDFC
Neutral
1,548
-
245,933
11,475
13,450
3.4
3.4
45.3
52.5
34.2
29.5
6.6
5.8
20.2
20.5
-
-
HDFC Bank
Neutral
1,626
-
416,977
46,097
55,433
4.5
4.5
58.4
68.0
27.8
23.9
4.9
4.1
18.8
18.6
-
-
ICICI Bank
Neutral
322
-
187,441
42,800
44,686
3.1
3.3
18.0
21.9
17.9
14.7
2.4
2.3
11.1
12.3
-
-
Karur Vysya Bank
Buy
118
140
7,128
5,640
6,030
3.3
3.2
8.9
10.0
13.3
11.8
1.4
1.3
11.2
11.4
-
-
Lakshmi Vilas Bank
Neutral
183
-
3,508
3,339
3,799
2.7
2.8
11.0
14.0
16.6
13.1
1.7
1.6
11.2
12.7
-
-
LIC Housing Finance
Neutral
704
-
35,516
3,712
4,293
2.6
2.5
39.0
46.0
18.0
15.3
3.4
2.9
19.9
20.1
-
-
Punjab Natl.Bank
Neutral
151
-
32,122
23,532
23,595
2.3
2.4
6.8
12.6
22.2
12.0
3.4
2.4
3.3
6.5
-
-
RBL Bank
Neutral
517
-
19,414
1,783
2,309
2.6
2.6
12.7
16.4
40.7
31.5
4.4
4.0
12.8
13.3
-
-
Repco Home Finance
Accumulate
778
825
4,870
388
457
4.5
4.2
30.0
38.0
26.0
20.5
4.3
3.6
18.0
19.2
-
-
South Ind.Bank
Neutral
27
-
4,860
6,435
7,578
2.5
2.5
2.7
3.1
10.0
8.7
1.3
1.1
10.1
11.2
-
-
St Bk of India
Neutral
288
-
233,929
88,650
98,335
2.6
2.6
13.5
18.8
21.4
15.3
2.0
1.8
7.0
8.5
-
-
Union Bank
Neutral
161
-
11,078
13,450
14,925
2.3
2.3
25.5
34.5
6.3
4.7
0.9
0.8
7.5
10.2
-
-
Yes Bank
Neutral
1,493
-
68,208
8,978
11,281
3.3
3.4
74.0
90.0
20.2
16.6
3.8
3.2
17.0
17.2
-
-
FMCG
Akzo Nobel India
Neutral
1,805
-
8,657
2,955
3,309
13.3
13.7
57.2
69.3
31.6
26.0
10.3
8.7
32.7
33.3
2.7
2.4
Asian Paints
Neutral
1,132
-
108,572
17,128
18,978
16.8
16.4
19.1
20.7
59.3
54.7
20.6
19.5
34.8
35.5
6.3
5.6
Britannia
Accumulate
3,413
3,626
40,951
9,594
11,011
14.6
14.9
80.3
94.0
42.5
36.3
17.5
13.5
41.2
-
4.1
3.6
Colgate
Neutral
999
-
27,167
4,605
5,149
23.4
23.4
23.8
26.9
42.0
37.1
23.2
18.2
64.8
66.8
5.8
5.2
Dabur India
Accumulate
271
304
47,649
8,315
9,405
19.8
20.7
8.1
9.2
33.4
29.4
9.3
7.7
31.6
31.0
5.4
4.7
GlaxoSmith Con*
Neutral
5,305
-
22,312
4,350
4,823
21.2
21.4
179.2
196.5
29.6
27.0
7.9
6.7
27.1
26.8
4.5
4.0
Stock Watch
May 29, 2017
Company Name
Reco
CMP
Target
Mkt Cap
Sales ( Čcr )
OPM(%)
EPS (Č)
PER(x)
P/BV(x)
RoE(%)
EV/Sales(x)
(Č)
Price ( Č)
( Č cr )
FY17E FY18E
FY17E
FY18E
FY17E
FY18E
FY17E
FY18E
FY17E
FY18E
FY17E
FY18E
FY17E
FY18E
FMCG
Godrej Consumer
Neutral
1,831
-
62,376
10,235
11,428
18.4
18.6
41.1
44.2
44.6
41.4
9.9
8.3
24.9
24.8
6.2
5.5
HUL
Neutral
1,041
-
225,244
35,252
38,495
17.8
17.8
20.7
22.4
50.4
46.5
48.2
41.3
95.6
88.9
6.2
5.7
ITC
Neutral
309
-
374,929
40,059
44,439
38.3
39.2
9.0
10.1
34.4
30.5
9.6
8.4
27.8
27.5
8.9
8.0
Marico
Neutral
316
-
40,727
6,430
7,349
18.8
19.5
6.4
7.7
49.3
41.0
14.9
12.5
33.2
32.5
6.1
5.3
Nestle*
Neutral
6,639
-
64,009
10,073
11,807
20.7
21.5
124.8
154.2
53.2
43.1
21.8
19.6
34.8
36.7
6.2
5.2
Tata Global
Neutral
147
-
9,271
8,675
9,088
9.8
9.8
7.4
8.2
19.9
17.9
1.6
1.5
7.9
8.1
1.0
0.9
Procter & Gamble
Neutral
7,550
-
24,509
2,939
3,342
23.2
23.0
146.2
163.7
51.6
46.1
13.1
10.9
25.3
23.5
7.9
6.9
Hygiene
IT
HCL Tech^
Buy
859
1,014
122,614
46,723
52,342
22.1
20.9
60.0
62.8
14.3
13.7
3.6
3.1
25.3
22.4
2.4
2.0
Infosys
Buy
996
1,179
228,822
68,484
73,963
26.0
26.0
63.0
64.0
15.8
15.6
3.3
3.1
20.8
19.7
3.0
2.7
TCS
Neutral
2,579
-
508,232
117,966
127,403
27.5
27.6
134.3
144.5
19.2
17.9
5.7
5.3
29.8
29.7
4.0
3.7
Tech Mahindra
Buy
429
600
41,851
29,673
32,937
15.5
17.0
32.8
39.9
13.1
10.8
2.6
2.2
19.6
20.7
1.2
1.0
Wipro
Accumulate
539
570
131,106
55,421
58,536
20.3
20.3
35.1
36.5
15.4
14.8
2.7
2.3
19.2
14.6
1.8
1.5
Media
D B Corp
Neutral
368
-
6,773
2,297
2,590
27.4
28.2
21.0
23.4
17.5
15.7
4.1
3.5
23.7
23.1
2.8
2.4
HT Media
Neutral
82
-
1,903
2,693
2,991
12.6
12.9
7.9
9.0
10.4
9.1
0.9
0.8
7.8
8.3
0.3
0.2
Jagran Prakashan
Buy
179
225
5,860
2,355
2,635
28.0
28.0
10.8
12.5
16.6
14.3
3.6
3.1
21.7
21.7
2.5
2.2
Sun TV Network
Neutral
808
-
31,856
2,850
3,265
70.1
71.0
26.2
30.4
30.9
26.6
7.9
7.0
24.3
25.6
10.8
9.3
Hindustan Media
Neutral
276
-
2,025
1,016
1,138
24.3
25.2
27.3
30.1
10.1
9.2
1.9
1.7
16.2
15.8
1.3
1.1
Ventures
TV Today Network
Buy
253
344
1,511
567
645
26.7
27.0
15.4
18.1
16.5
14.0
2.5
2.1
14.9
15.2
2.2
1.9
Metals & Mining
Coal India
Neutral
268
-
166,576
84,638
94,297
21.4
22.3
24.5
27.1
11.0
9.9
4.6
4.3
42.6
46.0
1.5
1.3
Hind. Zinc
Neutral
242
-
102,063
14,252
18,465
55.9
48.3
15.8
21.5
15.3
11.2
2.5
2.2
17.0
20.7
7.2
5.5
Hindalco
Neutral
199
-
44,542
107,899
112,095
7.4
8.2
9.2
13.0
21.6
15.3
1.0
1.0
4.8
6.6
0.9
0.9
JSW Steel
Neutral
199
-
48,139
53,201
58,779
16.1
16.2
130.6
153.7
1.5
1.3
0.2
0.2
14.0
14.4
1.7
1.4
NMDC
Neutral
117
-
36,907
6,643
7,284
44.4
47.7
7.1
7.7
16.4
15.2
1.4
1.4
8.8
9.2
3.3
3.0
SAIL
Neutral
59
-
24,450
47,528
53,738
(0.7)
2.1
(1.9)
2.6
22.8
0.6
0.6
(1.6)
3.9
1.4
1.2
Vedanta
Neutral
243
-
90,198
71,744
81,944
19.2
21.7
13.4
20.1
18.1
12.1
1.6
1.4
8.4
11.3
1.6
1.3
Tata Steel
Neutral
512
-
49,707
121,374
121,856
7.2
8.4
18.6
34.3
27.5
14.9
1.7
1.6
6.1
10.1
1.0
1.0
Oil & Gas
GAIL
Neutral
401
-
67,880
56,220
65,198
9.3
10.1
27.1
33.3
14.8
12.1
1.4
1.3
9.3
10.7
1.4
1.2
ONGC
Neutral
176
-
225,608
137,222
152,563
15.0
21.8
19.5
24.1
9.0
7.3
0.8
0.7
8.5
10.1
1.9
1.7
Indian Oil Corp
Neutral
426
-
206,886
373,359
428,656
5.9
5.5
54.0
59.3
7.9
7.2
1.2
1.1
16.0
15.6
0.7
0.6
Stock Watch
May 29, 2017
Company Name
Reco
CMP
Target
Mkt Cap
Sales ( Čcr )
OPM(%)
EPS (Č)
PER(x)
P/BV(x)
RoE(%)
EV/Sales(x)
(Č)
Price ( Č)
( Č cr )
FY17E FY18E
FY17E
FY18E
FY17E
FY18E
FY17E
FY18E
FY17E
FY18E
FY17E
FY18E
FY17E
FY18E
Oil & Gas
Reliance Industries
Neutral
1,336
-
434,327
301,963
358,039
12.1
12.6
87.7
101.7
15.2
13.1
1.6
1.4
10.7
11.3
1.9
1.6
Pharmaceuticals
Alembic Pharma
Buy
559
648
10,536
3,101
3,966
19.7
20.5
21.4
25.5
26.1
21.9
5.5
4.5
23.0
22.8
3.4
2.5
Alkem Laboratories Ltd
Buy
1,872
2,257
22,387
6,065
7,009
18.7
20.0
80.2
92.0
23.4
20.4
5.2
4.4
22.5
21.6
3.6
3.1
Aurobindo Pharma
Buy
533
877
31,242
15,720
18,078
23.7
23.7
41.4
47.3
12.9
11.3
3.4
2.6
29.6
26.1
2.2
1.9
Aventis*
Neutral
4,011
-
9,238
2,206
2,508
16.6
16.8
128.9
139.9
31.1
28.7
5.3
4.2
21.6
23.5
4.0
3.3
Cadila Healthcare
Neutral
444
-
45,418
10,429
12,318
17.7
21.6
13.1
19.2
33.9
23.1
7.1
5.6
22.8
27.1
4.4
3.6
Cipla
Reduce
492
465
39,552
15,378
18,089
15.7
16.8
19.3
24.5
25.5
20.1
3.0
2.6
12.3
13.9
2.7
2.3
Dr Reddy's
Neutral
2,412
-
39,956
14,081
15,937
16.1
18.6
72.6
105.9
33.2
22.8
3.3
2.9
9.6
13.6
3.1
2.7
Dishman Pharma
Sell
293
143
4,723
1,718
1,890
22.7
22.8
9.5
11.3
30.8
25.9
3.0
2.7
10.1
10.9
3.2
2.8
GSK Pharma*
Neutral
2,367
-
20,048
2,927
3,290
11.8
16.2
34.4
49.6
68.8
47.7
10.0
10.4
13.9
21.3
6.6
6.0
Indoco Remedies
Buy
197
240
1,816
1,112
1,289
16.2
18.2
11.6
16.0
17.0
12.3
2.7
2.3
17.0
20.1
1.8
1.5
Ipca labs
Buy
504
613
6,353
3,258
3,747
12.8
15.3
12.1
19.2
41.6
26.2
2.6
2.4
6.4
9.5
2.1
1.8
Lupin
Buy
1,112
1,809
50,221
15,912
18,644
26.4
26.7
58.1
69.3
19.1
16.0
3.7
3.1
21.4
20.9
3.2
2.6
Natco Pharma
Accumulate
898
974
15,644
2,090
2,335
32.1
26.6
26.8
23.2
33.4
38.7
9.5
8.2
28.4
21.1
7.6
92.7
Sun Pharma
Buy
569
847
136,408
31,129
35,258
32.0
32.9
30.2
35.3
18.8
16.1
3.1
2.5
20.0
20.1
4.0
3.3
Power
Tata Power
Neutral
81
-
21,922
36,916
39,557
17.4
27.1
5.1
6.3
15.9
12.9
1.4
1.3
9.0
10.3
1.6
1.4
NTPC
Neutral
156
-
128,753
86,605
95,545
17.5
20.8
11.8
13.4
13.2
11.7
1.3
1.3
10.5
11.1
2.8
2.8
Power Grid
Accumulate
203
223
106,123
25,315
29,193
88.2
88.7
14.2
17.2
14.3
11.8
2.2
1.9
15.2
16.1
8.8
7.9
Real Estate
Prestige Estate
Neutral
235
-
8,824
4,707
5,105
25.2
26.0
10.3
13.0
22.8
18.1
1.8
1.7
10.3
10.2
3.0
2.7
MLIFE
Buy
434
522
2,228
1,152
1,300
22.7
24.6
29.9
35.8
14.5
12.1
1.1
1.0
7.6
8.6
2.7
2.2
Telecom
Bharti Airtel
Neutral
374
-
149,383
105,086
114,808
34.5
34.7
12.2
16.4
30.6
22.8
2.1
1.9
6.8
8.4
2.3
2.0
Idea Cellular
Neutral
80
-
28,720
40,133
43,731
37.2
37.1
6.4
6.5
12.5
12.3
1.0
1.0
8.2
7.6
1.7
1.5
zOthers
Abbott India
Neutral
4,104
-
8,720
3,153
3,583
14.1
14.4
152.2
182.7
27.0
22.5
132.4
113.0
25.6
26.1
2.5
2.1
Asian Granito
Accumulate
355
405
1,067
1,060
1,169
12.2
12.5
12.7
15.9
28.0
22.3
2.7
2.4
9.5
10.7
1.3
1.1
Bajaj Electricals
Accumulate
360
395
3,644
4,801
5,351
5.7
6.2
10.4
13.7
34.5
26.3
4.3
3.8
12.4
14.5
0.8
0.7
Banco Products (India)
Neutral
223
-
1,596
1,353
1,471
12.3
12.4
14.5
16.3
15.4
13.7
21.3
19.2
14.5
14.6
1.1
120.4
Coffee Day Enterprises
Neutral
252
-
5,201
2,964
3,260
20.5
21.2
4.7
8.0
-
31.5
2.9
2.7
5.5
8.5
2.2
1.9
Ltd
Competent Automobiles Neutral
202
-
129
1,137
1,256
3.1
2.7
28.0
23.6
7.2
8.6
38.9
35.1
14.3
11.5
0.1
0.1
Elecon Engineering
Neutral
62
-
697
1,482
1,660
13.7
14.5
3.9
5.8
15.9
10.7
3.7
3.4
7.8
10.9
0.8
0.7
Stock Watch
May 29, 2017
Company Name
Reco
CMP
Target
Mkt Cap
Sales ( Čcr )
OPM(%)
EPS (Č)
PER(x)
P/BV(x)
RoE(%)
EV/Sales(x)
(Č)
Price ( Č)
( Č cr )
FY17E
FY18E
FY17E
FY18E
FY17E
FY18E
FY17E
FY18E
FY17E
FY18E
FY17E
FY18E
FY17E
FY18E
zOthers
Finolex Cables
Neutral
522
-
7,986
2,883
3,115
12.0
12.1
14.2
18.6
36.8
28.1
19.6
17.1
15.8
14.6
2.5
2.2
Garware Wall Ropes
Neutral
781
-
1,708
863
928
15.1
15.2
36.4
39.4
21.5
19.8
3.9
3.3
17.5
15.9
1.9
1.7
Goodyear India*
Neutral
814
-
1,878
1,598
1,704
10.4
10.2
49.4
52.6
16.5
15.5
76.1
66.7
18.2
17.0
0.9
121.6
Hitachi
Neutral
1,931
-
5,250
2,081
2,433
8.8
8.9
33.4
39.9
57.8
48.4
46.6
38.9
22.1
21.4
2.5
2.1
HSIL
Neutral
339
-
2,449
2,384
2,515
15.8
16.3
15.3
19.4
22.1
17.5
22.0
18.9
7.8
9.3
1.2
1.1
Interglobe Aviation
Neutral
1,092
-
39,467
21,122
26,005
14.5
27.6
110.7
132.1
9.9
8.3
59.0
42.2
168.5
201.1
1.8
1.5
Jyothy Laboratories
Neutral
371
-
6,732
1,440
2,052
11.5
13.0
8.5
10.0
43.6
37.1
10.6
9.8
18.6
19.3
5.0
3.5
Kirloskar Engines India
Neutral
384
-
5,546
2,554
2,800
9.9
10.0
10.5
12.1
36.5
31.7
15.3
14.4
10.7
11.7
1.8
1.6
Ltd
Linc Pen & Plastics
Neutral
269
-
398
382
420
9.3
9.5
13.5
15.7
20.0
17.1
3.4
3.0
17.1
17.3
1.1
1.0
M M Forgings
Neutral
605
-
730
546
608
20.4
20.7
41.3
48.7
14.7
12.4
82.8
73.3
16.6
17.0
1.2
1.1
Manpasand Bever.
Neutral
846
-
4,839
836
1,087
19.6
19.4
16.9
23.8
50.1
35.5
6.0
5.2
12.0
14.8
5.5
4.2
Mirza International
Neutral
148
-
1,785
963
1,069
17.2
18.0
6.1
7.5
24.2
19.8
3.7
3.1
15.0
15.7
2.1
1.9
MT Educare
Neutral
64
-
256
366
417
17.7
18.2
9.4
10.8
6.9
6.0
1.5
1.3
22.2
22.3
0.6
0.5
Narayana Hrudaya
Neutral
295
-
6,025
1,873
2,166
11.5
11.7
2.6
4.0
111.5
74.4
6.8
6.2
6.1
8.3
3.3
2.9
Navkar Corporation
Buy
208
265
2,970
369
561
42.9
42.3
6.9
11.5
30.1
18.1
2.1
1.9
7.4
10.5
9.1
6.0
Navneet Education
Neutral
168
-
3,925
1,062
1,147
24.0
24.0
6.1
6.6
27.6
25.4
5.7
5.0
20.6
19.8
3.8
3.5
Nilkamal
Neutral
2,008
-
2,997
1,995
2,165
10.7
10.4
69.8
80.6
28.8
24.9
114.8
99.7
16.6
16.5
1.5
1.3
Page Industries
Neutral
14,341
-
15,996
2,450
3,124
20.1
17.6
299.0
310.0
48.0
46.3
319.4
243.8
47.1
87.5
6.6
5.2
Parag Milk Foods
Neutral
248
-
2,086
1,919
2,231
9.3
9.6
9.5
12.9
26.3
19.2
4.1
3.4
15.5
17.5
1.2
1.1
Quick Heal
Neutral
213
-
1,492
408
495
27.3
27.0
7.7
8.8
27.5
24.2
2.6
2.6
9.3
10.6
2.8
2.3
Radico Khaitan
Buy
121
147
1,607
1,667
1,824
13.0
13.2
6.7
8.2
18.2
14.8
1.6
1.5
9.0
10.2
1.4
1.2
Relaxo Footwears
Neutral
477
-
5,728
2,085
2,469
9.2
8.2
7.6
8.0
63.1
60.0
24.5
20.9
17.9
18.8
2.8
2.4
S H Kelkar & Co.
Neutral
281
-
4,067
1,036
1,160
15.1
15.0
6.1
7.2
46.1
39.2
4.9
4.5
10.7
11.5
3.8
3.4
Siyaram Silk Mills
Accumulate
1,780
1,872
1,669
1,652
1,857
11.6
11.7
92.4
110.1
19.3
16.2
2.8
2.5
14.7
15.2
1.2
1.1
Styrolution ABS India*
Neutral
745
-
1,310
1,440
1,537
9.2
9.0
40.6
42.6
18.3
17.5
46.8
42.6
12.3
11.6
0.9
0.8
Surya Roshni
Neutral
272
-
1,193
3,342
3,625
7.8
7.5
17.3
19.8
15.8
13.8
29.9
24.0
10.5
10.8
0.6
0.6
Team Lease Serv.
Neutral
1,156
-
1,976
3,229
4,001
1.5
1.8
22.8
32.8
50.8
35.2
5.4
4.7
10.7
13.4
0.5
0.4
The Byke Hospitality
Neutral
196
-
785
287
384
20.5
20.5
7.6
10.7
25.8
18.3
5.4
4.4
20.7
23.5
2.8
2.0
Transport Corporation of
Neutral
260
-
1,993
2,671
2,911
8.5
8.8
13.9
15.7
18.8
16.6
2.6
2.3
13.7
13.8
0.9
0.8
India
Stock Watch
May 29, 2017
Company Name
Reco
CMP
Target Mkt Cap
Sales ( Čcr )
OPM(%)
EPS (Č)
PER(x)
P/BV(x)
RoE(%)
EV/Sales(x)
(Č)
Price ( Č)
( Č cr )
FY17E FY18E FY17E FY18E FY17E FY18E FY17E FY18E FY17E FY18E FY17E FY18E FY17E FY18E
zOthers
TVS Srichakra
Neutral
3,947
-
3,022
2,304
2,614
13.7
13.8
231.1
266.6
17.1
14.8
443.5
349.2
33.9
29.3
1.3
1.1
UFO Moviez
Neutral
386
-
1,066
619
685
33.2
33.4
30.0
34.9
12.9
11.1
1.8
1.5
13.8
13.9
1.4
1.1
Visaka Industries
Neutral
357
-
568
1,051
1,138
10.3
10.4
21.0
23.1
17.0
15.4
45.8
42.9
9.0
9.2
0.8
0.8
VRL Logistics
Neutral
314
-
2,862
1,902
2,119
16.7
16.6
14.6
16.8
21.5
18.6
4.7
4.1
21.9
22.2
1.6
1.4
VIP Industries
Accumulate
194
218
2,738
1,270
1,450
10.4
10.4
5.6
6.5
34.6
29.8
7.2
6.3
20.7
21.1
2.2
1.9
Navin Fluorine
Buy
2,946
3,650
2,885
789
945
21.1
22.4
120.1
143.4
24.5
20.5
3.9
3.4
17.8
18.5
3.6
2.9
Source: Company, Angel Research; Note: *December year end; #September year end; &October year end; Price as on May 26, 2017
Market Outlook
May 29, 2017
Research Team Tel: 022 - 39357800
DISCLAIMER
Angel Broking Private Limited (hereinafter referred to as “Angel”) is a registered Member of National Stock Exchange of India
Limited,Bombay Stock Exchange Limited and Metropolitan Stock Exchange Limited. It is also registered as a Depository Participant with
CDSL and Portfolio Manager with SEBI. It also has registration with AMFI as a Mutual Fund Distributor. Angel Broking Private Limited is a
registered entity with SEBI for Research Analyst in terms of SEBI (Research Analyst) Regulations, 2014 vide registration number
INH000000164. Angel or its associates has not been debarred/ suspended by SEBI or any other regulatory authority for accessing
/dealing in securities Market. Angel or its associates/analyst has not received any compensation / managed or
co-managed public offering of securities of the company covered by Analyst during the past twelve months.
This document is solely for the personal information of the recipient, and must not be singularly used as the basis of any investment
decision. Nothing in this document should be construed as investment or financial advice. Each recipient of this document should make
such investigations as they deem necessary to arrive at an independent evaluation of an investment in the securities of the companies
referred to in this document (including the merits and risks involved), and should consult their own advisors to determine the merits and
risks of such an investment.
Reports based on technical and derivative analysis center on studying charts of a stock's price movement, outstanding positions and
trading volume, as opposed to focusing on a company's fundamentals and, as such, may not match with a report on a company's
fundamentals. Investors are advised to refer the Fundamental and Technical Research Reports available on our website to evaluate the
contrary view, if any.
The information in this document has been printed on the basis of publicly available information, internal data and other reliable
sources believed to be true, but we do not represent that it is accurate or complete and it should not be relied on as such, as this
document is for general guidance only. Angel Broking Pvt. Limited or any of its affiliates/ group companies shall not be in any way
responsible for any loss or damage that may arise to any person from any inadvertent error in the information contained in this report.
Angel Broking Pvt. Limited has not independently verified all the information contained within this document. Accordingly, we cannot
testify, nor make any representation or warranty, express or implied, to the accuracy, contents or data contained within this document.
While Angel Broking Pvt. Limited endeavors to update on a reasonable basis the information discussed in this material, there may be
regulatory, compliance, or other reasons that prevent us from doing so.
This document is being supplied to you solely for your information, and its contents, information or data may not be reproduced,
redistributed or passed on, directly or indirectly.
Neither Angel Broking Pvt. Limited, nor its directors, employees or affiliates shall be liable for any loss or damage that may arise from
or in connection with the use of this information.